Descriptive stats
- distribution (skew, kurtosis)
- central tendency (mean, median mode)
- dispersion (SD, variance, range)
Analyze -> Descriptive Stats -> Descriptives
- move variables into box on right
- click “Options” and choose the descriptives that you want
- click “OK”
- you can split the file beforehand to look at (eg) gender separately
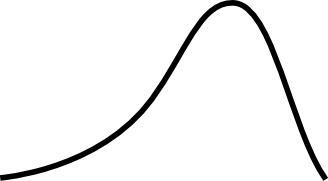
Skew
- may affect analyses because we assume normality
- positive number =
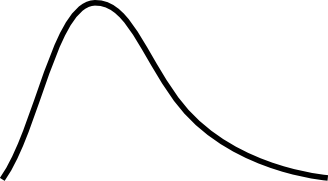
- negative number =
- 0 = normal distribution
Kurtosis
- no impact on results
- positive number = leptokurtic
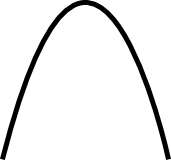 (scores clustered tight)
 - negative number = platycurtic
 (scores not clustered)
 - 0 = mesokurtic (normal distribution)