Removing feminism from politics A-level – ??!!!

How can such a huge POLITICAL movement be removed from the teaching of POLITICS?!  Teaching girls and young women about their political history  and the movements that increased gender equality is vital.  Women are consistently under-represented in such domains, which means girls have fewer role models than boys do, and it suggests that women should not be involved in these areas, which in turn reduces their aspirations.

Please sign the petition linked in the article.

Plan to axe feminism from A-level politics triggers protest
 

SPSS, part 3: Frequencies

% frequencies may look big, but they depend on the number of participants, so always look at the normal frequency to compare.

Analyze -> Descriptive Stats -> Frequencies

  • move variables into box on right
  • click “Statistics” to choose only the descriptives and percentiles you want along with the frequencies
  • click “Charts” to choose histograms (continuous variables) or bar charts (categorical variables)
  • you can split the file beforehand to look at (e.g.) gender separately

To get box-plots you have to use Analyze -> Descriptive Stats -> Explore

  • put variables in the “Dependent List”
  • put variable you want to split file by in “Factor List”
  • click “Plots” to choose histogram too, and tick “Both” at bottom

Box-plots

  • use mainly to compare the max and min values of groups
  • longer horizontal line = more variation in scores (range is bigger)
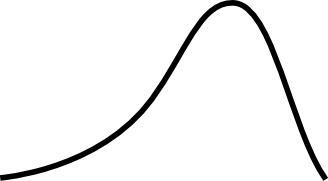
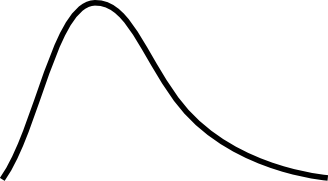
  • box-pos-skew = positive skew = skew_pos
  • box-neg-skew = negative skew = skew_neg
  • can compare medians:

box-plot

SPSS, part 2: Descriptive stats

Descriptive stats

  • distribution (skew, kurtosis)
  • central tendency (mean, median mode)
  • dispersion (SD, variance, range)

Analyze -> Descriptive Stats -> Descriptives

  • move variables into box on right
  • click “Options” and choose the descriptives that you want
  • click “OK”
  • you can split the file beforehand to look at (eg) gender separately

Skew

  • may affect analyses because we assume normality
  • positive number = skew_pos
  • negative number = skew_neg
  • 0 = normal distribution

Kurtosis

  • no impact on results
  • positive number = leptokurtic kurt_pos (scores clustered tight)
  • negative number = platycurtic kurt_neg (scores not clustered)
  • 0 = mesokurtic (normal distribution)